TUI guide
A tour of the Evaluar TUI — what each view does, the bindings that exist, and the OpenCV bbox editor it hands off to.
The Evaluar TUI is built on Textual. It's intentionally small: six views, a couple of modals, and a hand-off to a separate OpenCV process for any time you need to look at predictions on the source image. This page is a tour; the canonical keymap reference is the source of truth for bindings.
Launching the TUI
evaluarRunning the binary with no arguments launches the TUI with the home view (src/evaluar/cli/main.py:45). For a saved run you can also do:
evaluar report show <run_id>which opens directly into the results view for that run.
The views
The TUI is composed of widget classes under src/evaluar/tui/views/:
| View | File | Purpose |
|---|---|---|
| Splash | splash.py | Brief intro on first boot; fades into Home. |
| Home | home.py | Recent-runs list, primary entry point. |
| Results | results.py | Detail view for a single run — metrics, samples, charts. |
| Failure inspector | failure_inspector.py | Side-by-side diff + samples list for failed records. |
| Dashboard | dashboard.py | Live monitor while a run is in flight. |
| Compare | compare.py | Side-by-side comparison of two saved runs. |
Image work is handed off to the bbox editor subprocess; the TUI itself stays focused on run navigation, scorecards, charts, and failure inspection.
Home view
The home view lists every run in the current --results-dir (default evaluar/results/). Each row shows the run id, suite name, verdict, and timestamp.
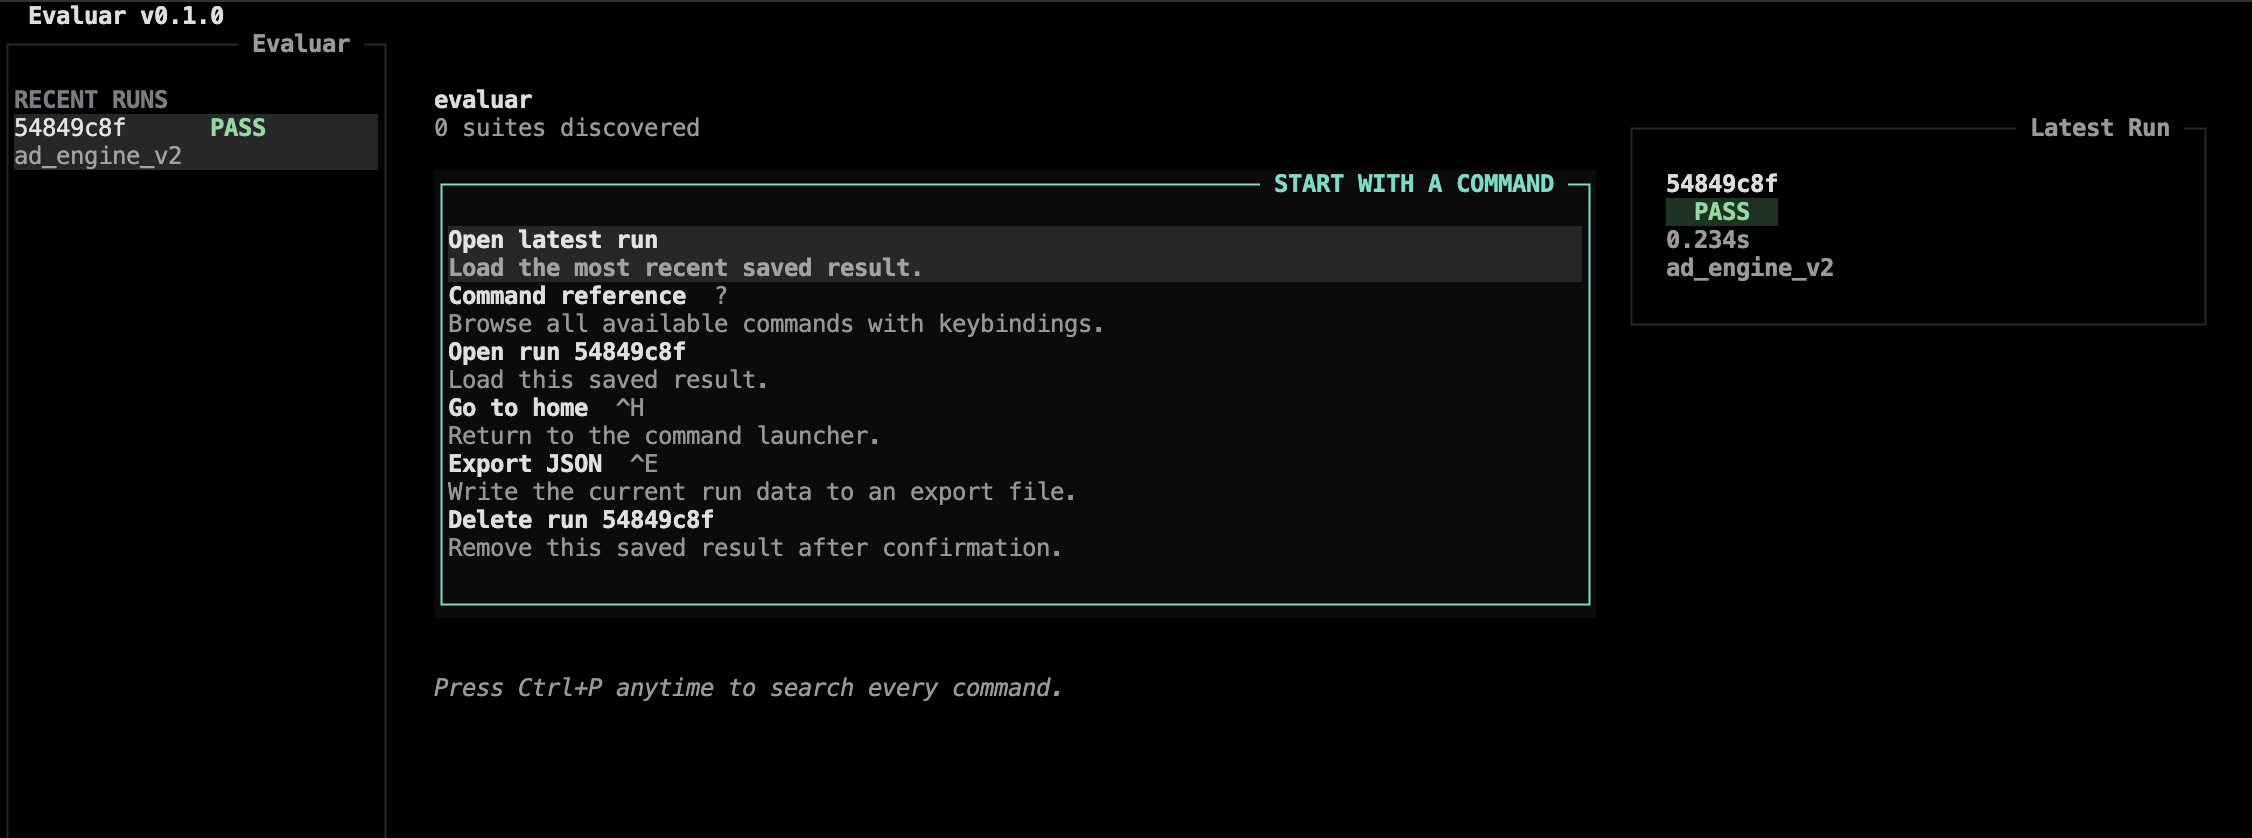
The global bindings are always live (src/evaluar/tui/app.py:99):
| ctrl+h | Return to the home view |
| ctrl+l | Toggle the log pane |
| ctrl+p | Open the command palette |
| ? | Open the command reference modal |
| ctrl+c | Quit |
Results view
The results view is what you see after opening a run. Three panes — models on the left, evaluation in the middle, samples + charts on the right.
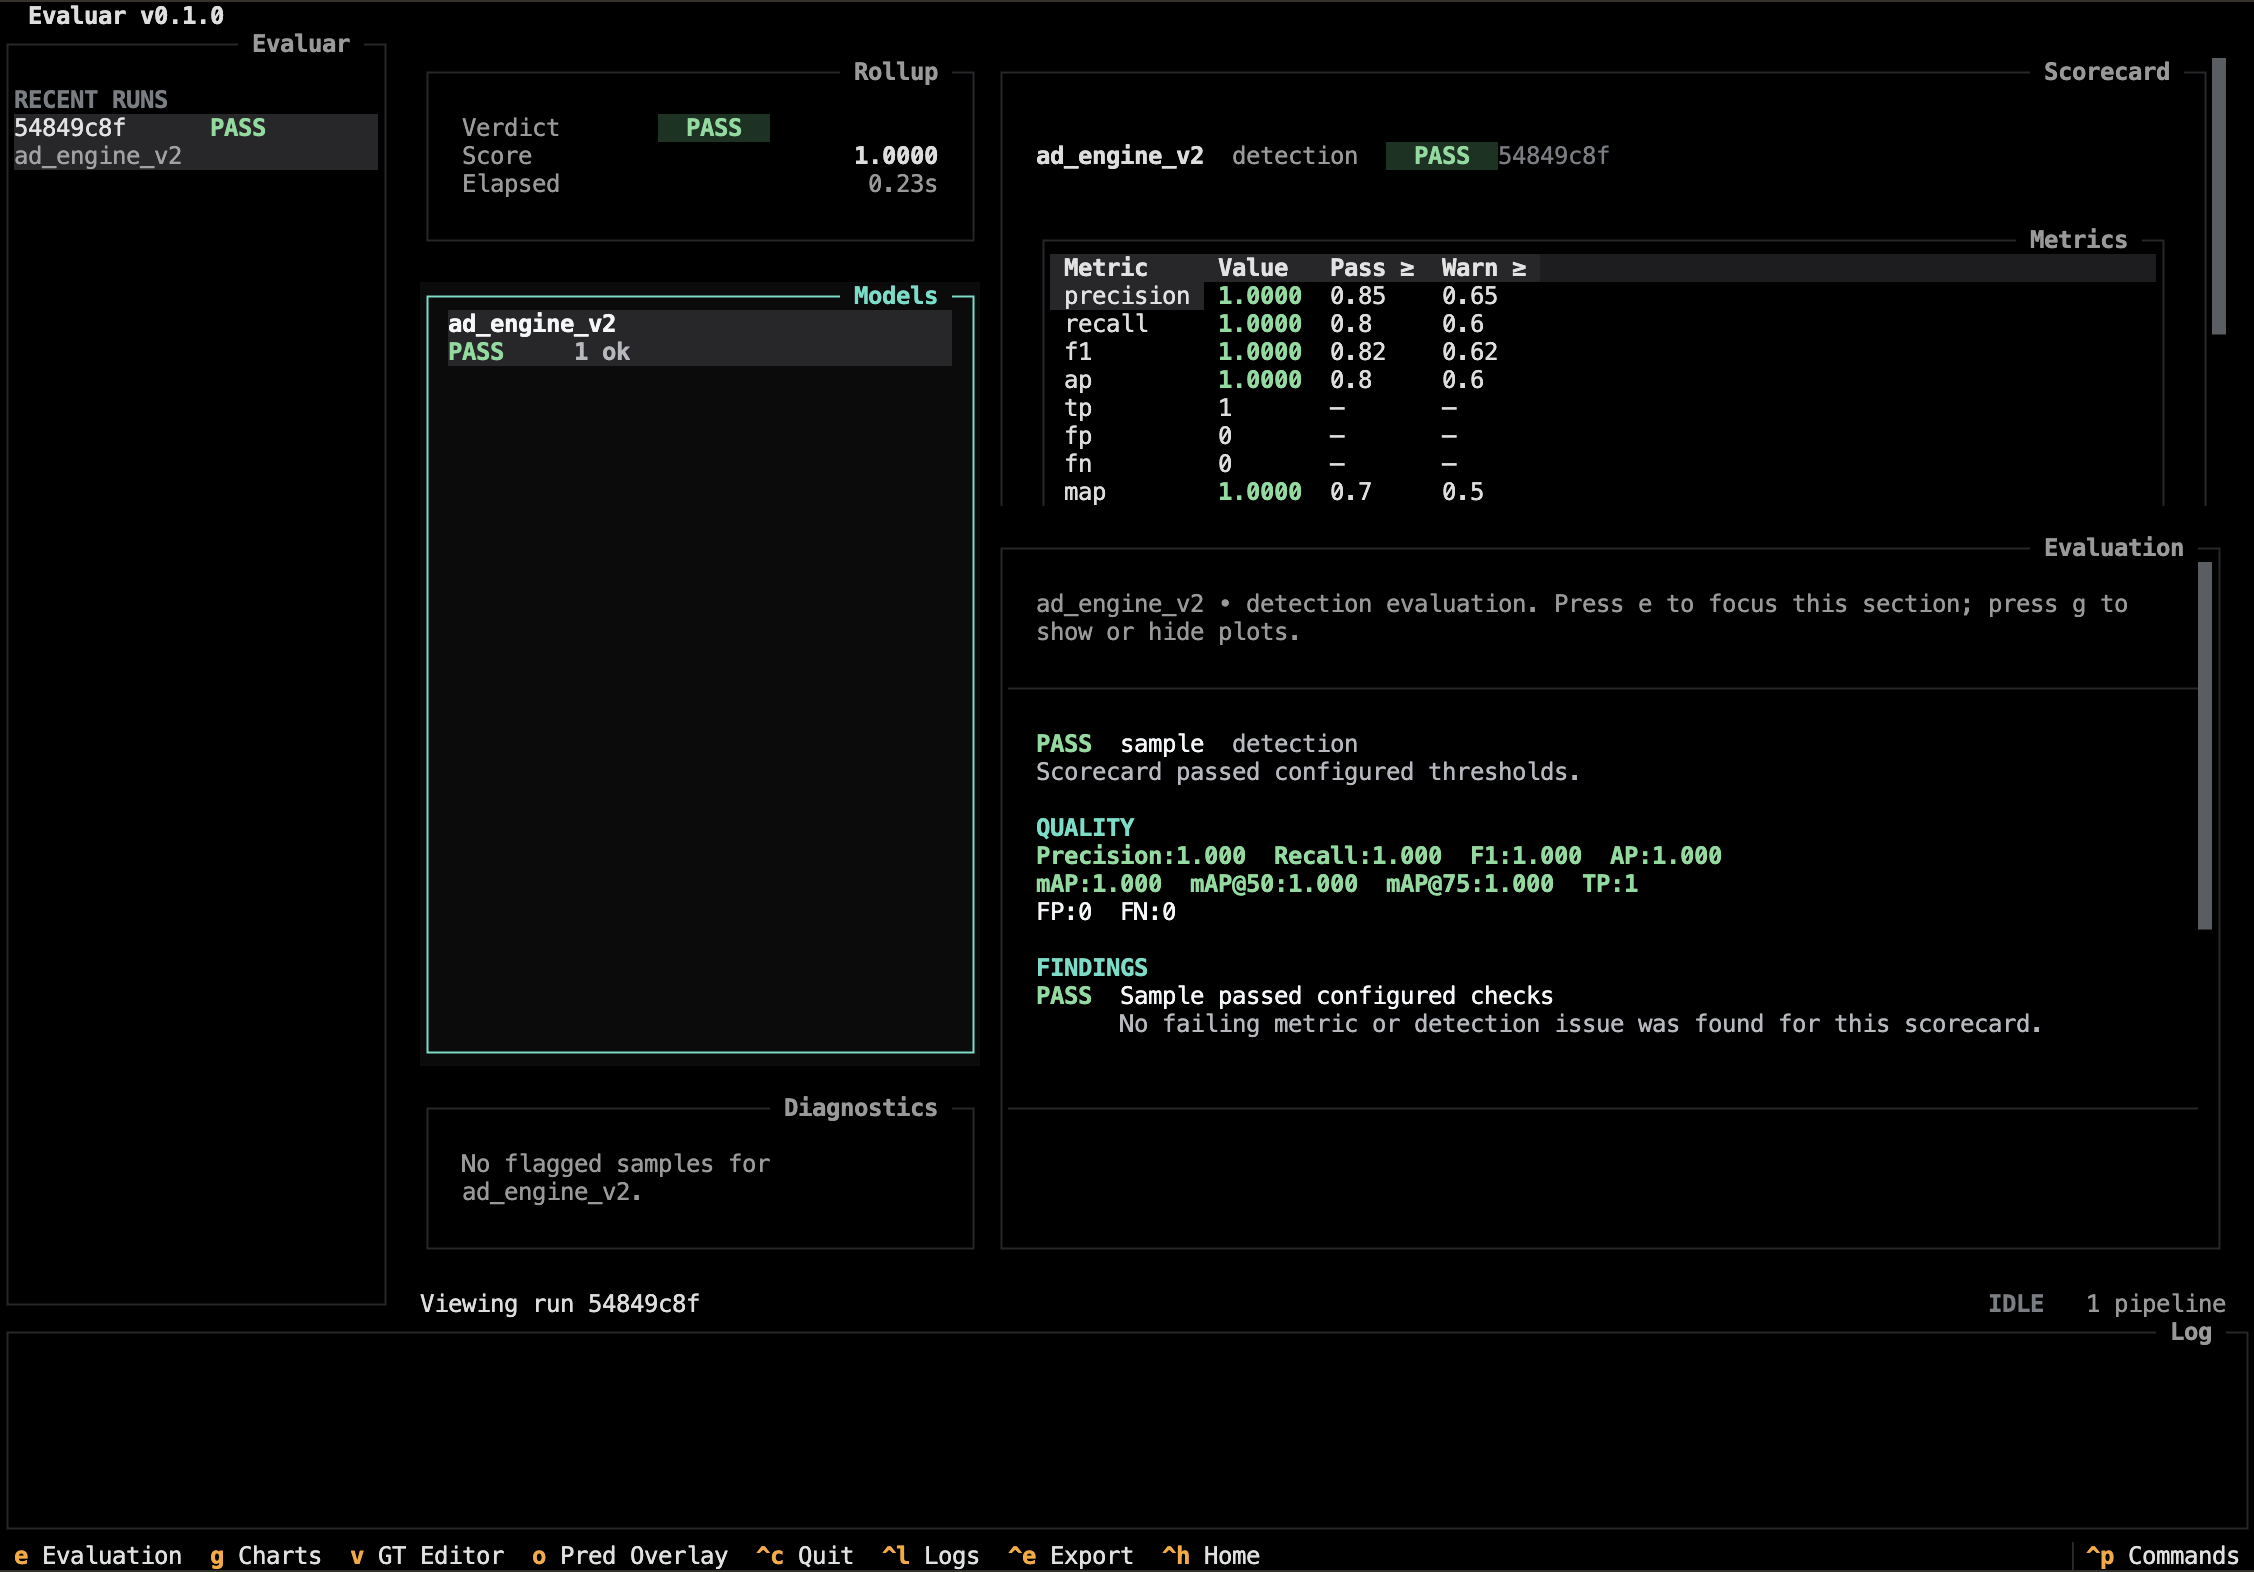
Bindings (src/evaluar/tui/views/results.py:30):
| e | Focus the evaluation pane |
| g | Toggle the charts widget |
| i | Open the failure inspector |
| o | Open the bbox editor (overlay, read-only) |
| v | Open the bbox editor (edit ground truth) |
| left+right | Move focus between panes |
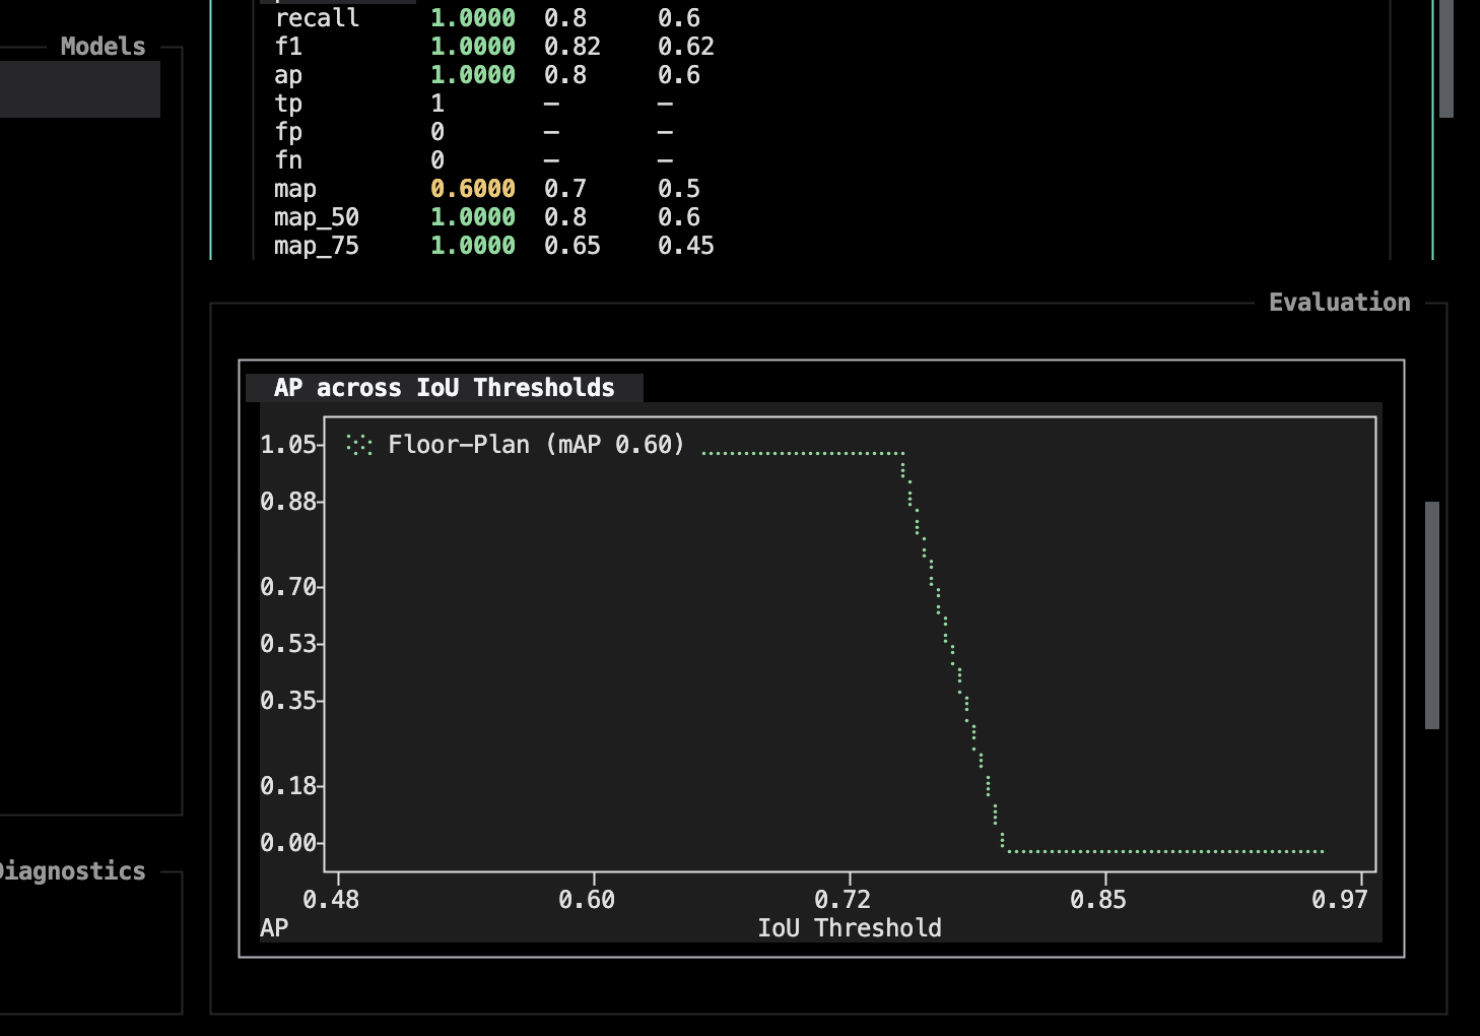
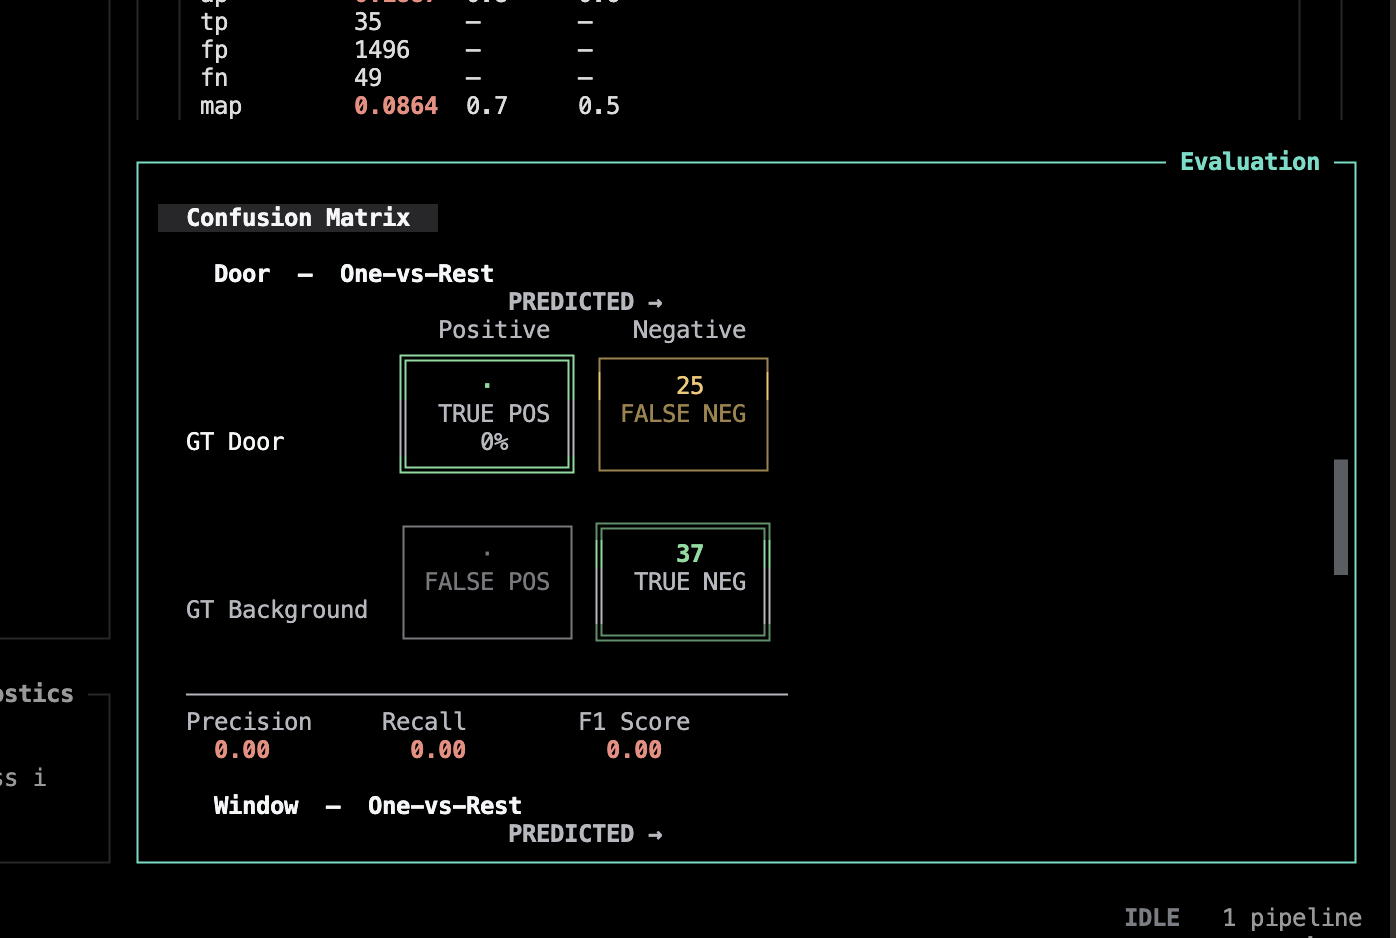
g toggles the charts widget — a metric-over-samples plot rendered with textual-plotext (src/evaluar/tui/widgets/charts.py). Here you can view the AP across IoU thresholds, per-class AP and per-class confusion matrices.
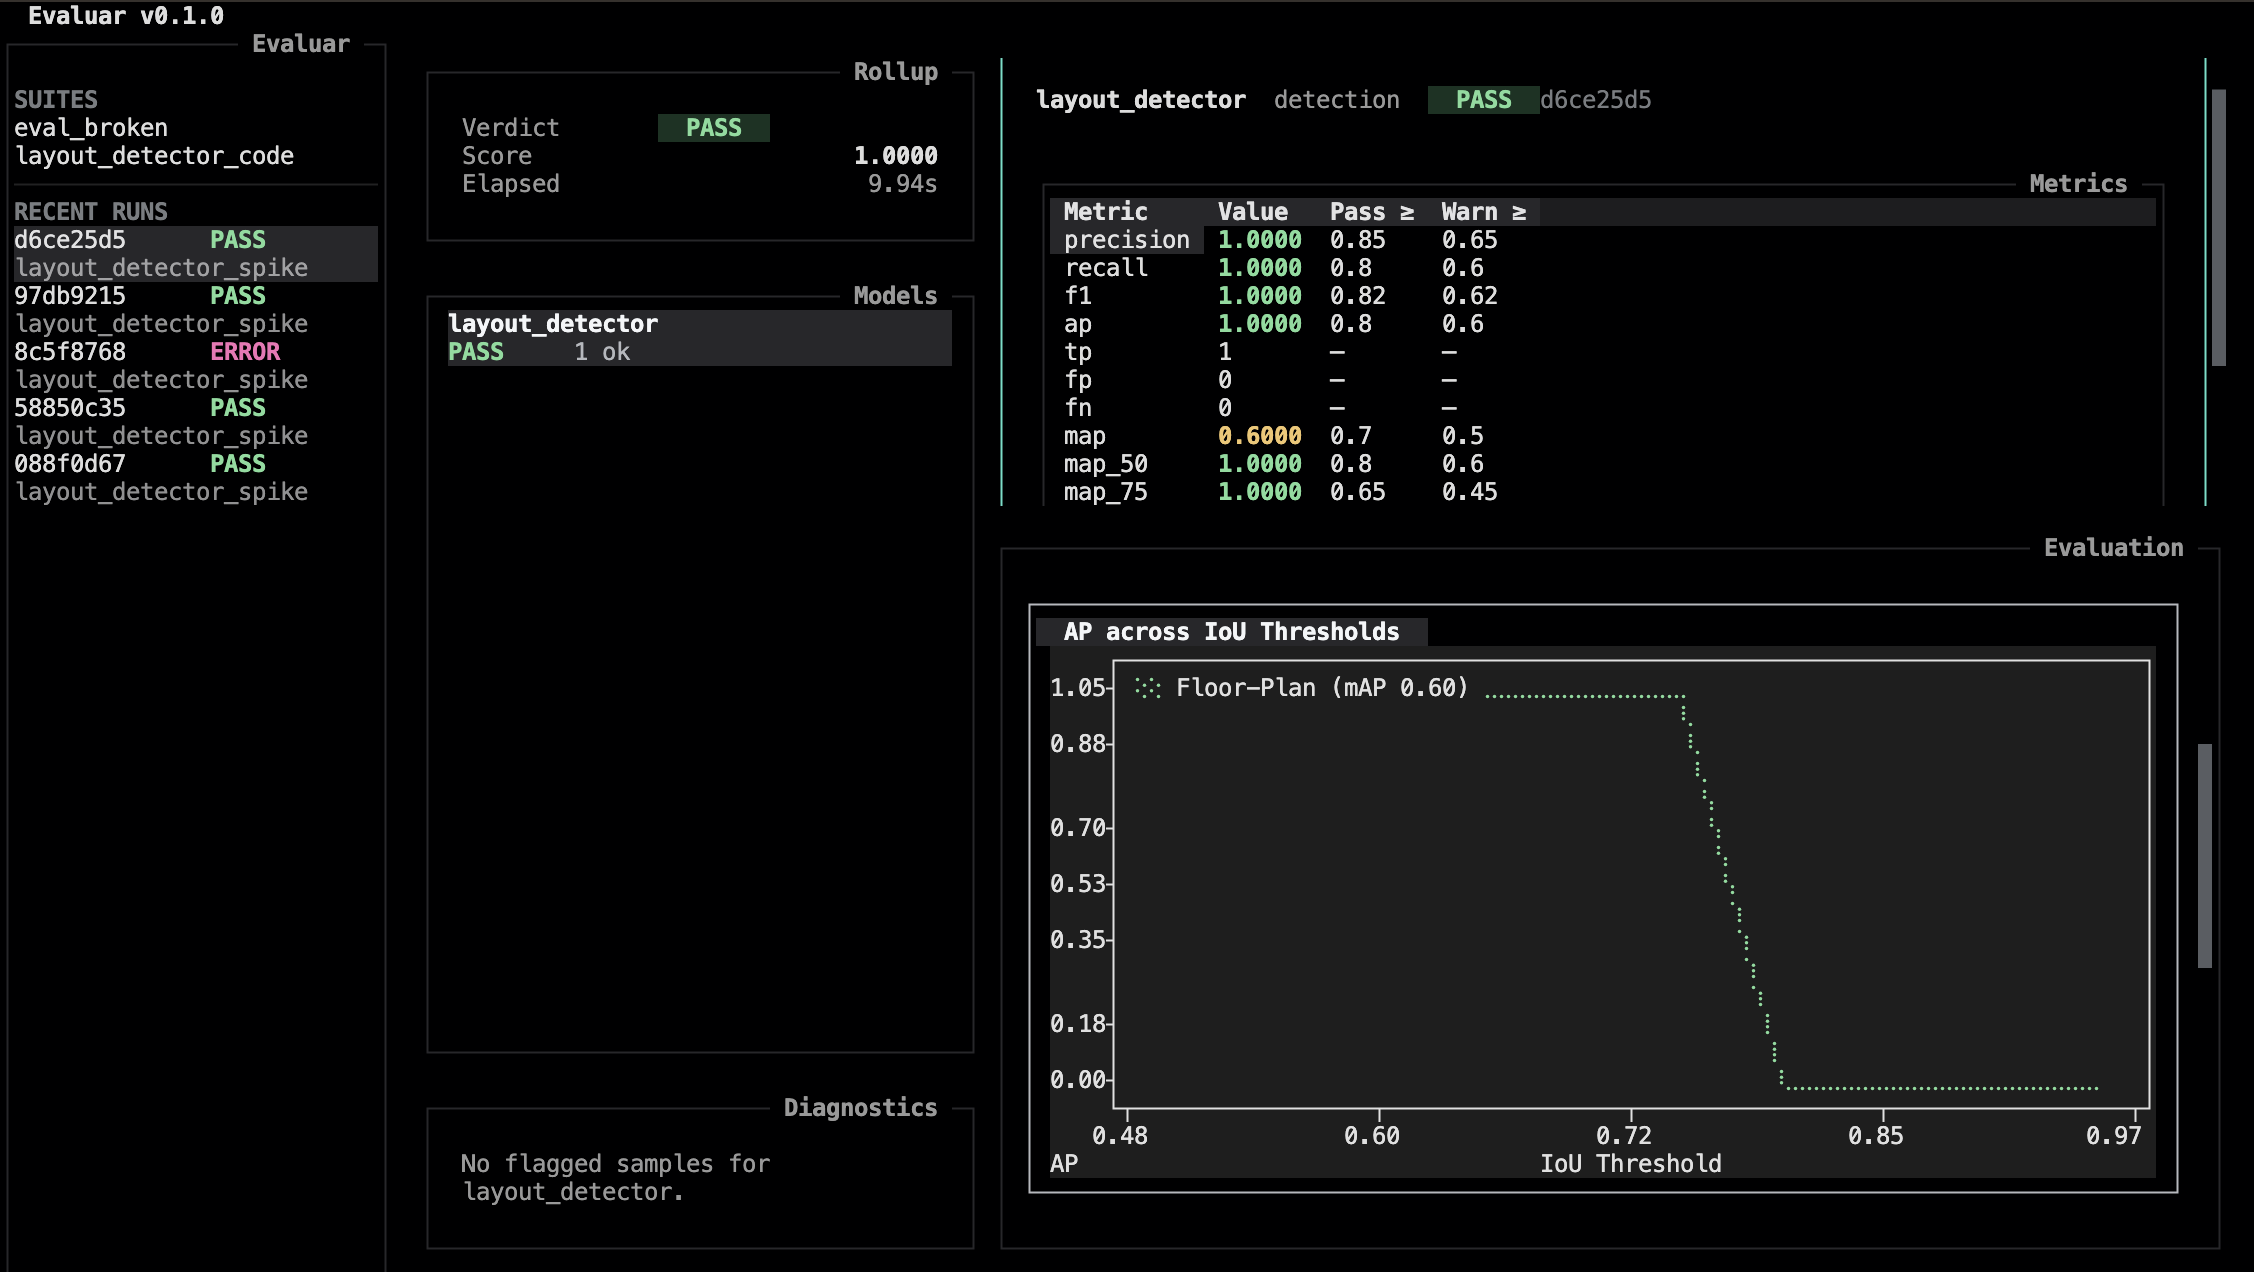
Reading Detection Charts
These charts are meant to answer practical model-quality questions: did the model find the right objects, put boxes in the right place, and use the right labels?
- IoU means "how much does the predicted box overlap the ground-truth box?" A high IoU means the box landed tightly on the expected object. A low IoU means the box is shifted, too large, too small, or on the wrong object.
- AP (Average Precision) is a compact score for how well the model balances finding real objects while avoiding extra false detections. Higher is better. In detection work, AP drops when the model misses objects, predicts too many extras, uses the wrong label, or draws boxes that do not overlap enough.
- AP across IoU thresholds shows how strictness changes the score. If AP is good at low IoU but falls sharply at high IoU, the model usually knows where objects are roughly located but needs tighter boxes.
- Per-class AP helps isolate which labels are weak. A model may be solid on
Doorbut poor onWindow, even if the overall score hides that difference. - A confusion matrix shows label mistakes. Rows are ground truth; columns are predictions. The diagonal is where labels match. Off-diagonal cells show what the model confused, and missed entries show objects it failed to detect.
Use these visuals as a triage map. Start with the overall trend, check which classes are weak, then open the failure inspector or bbox overlay to inspect specific samples behind the numbers.
Failure inspector
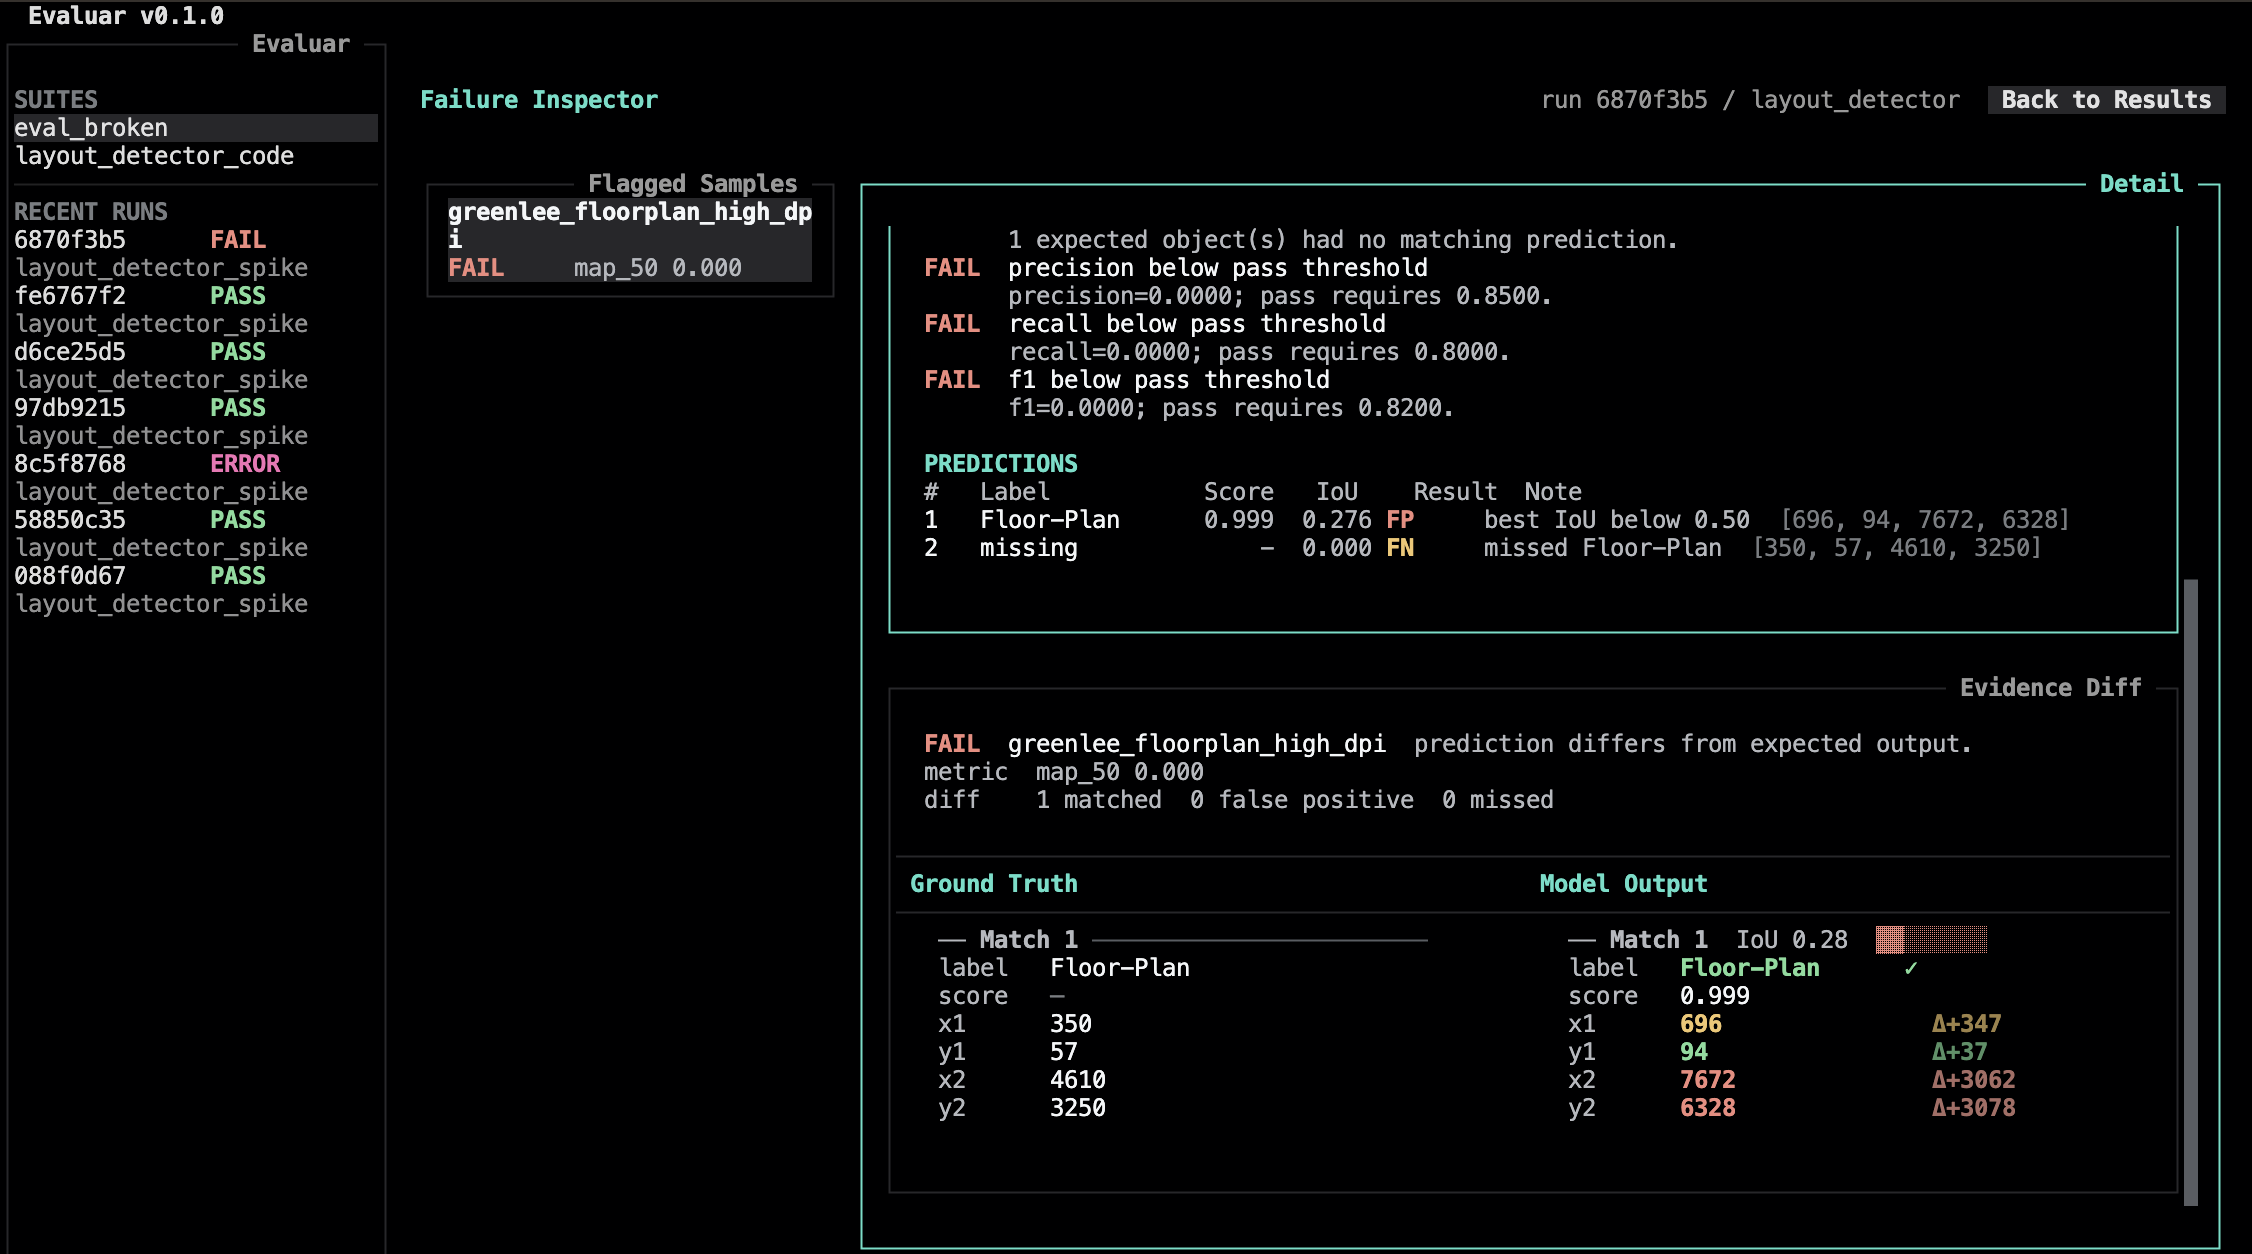
Press i from the results view to enter the failure inspector. Two panes: a structured diff for the focused sample, and the list of samples in the run.
Bindings (src/evaluar/tui/views/failure_inspector.py:27):
| d | Focus the diff pane |
| s | Focus the samples pane |
| o | Open the bbox editor (overlay) |
| v | Open the bbox editor (edit) |
| tab | Cycle focus forward |
| left | Cycle focus backward |
| b | Go back to the previous view |
| escape | Go back to the previous view |
See Failure inspection for the supported inspection workflow.
Dashboard
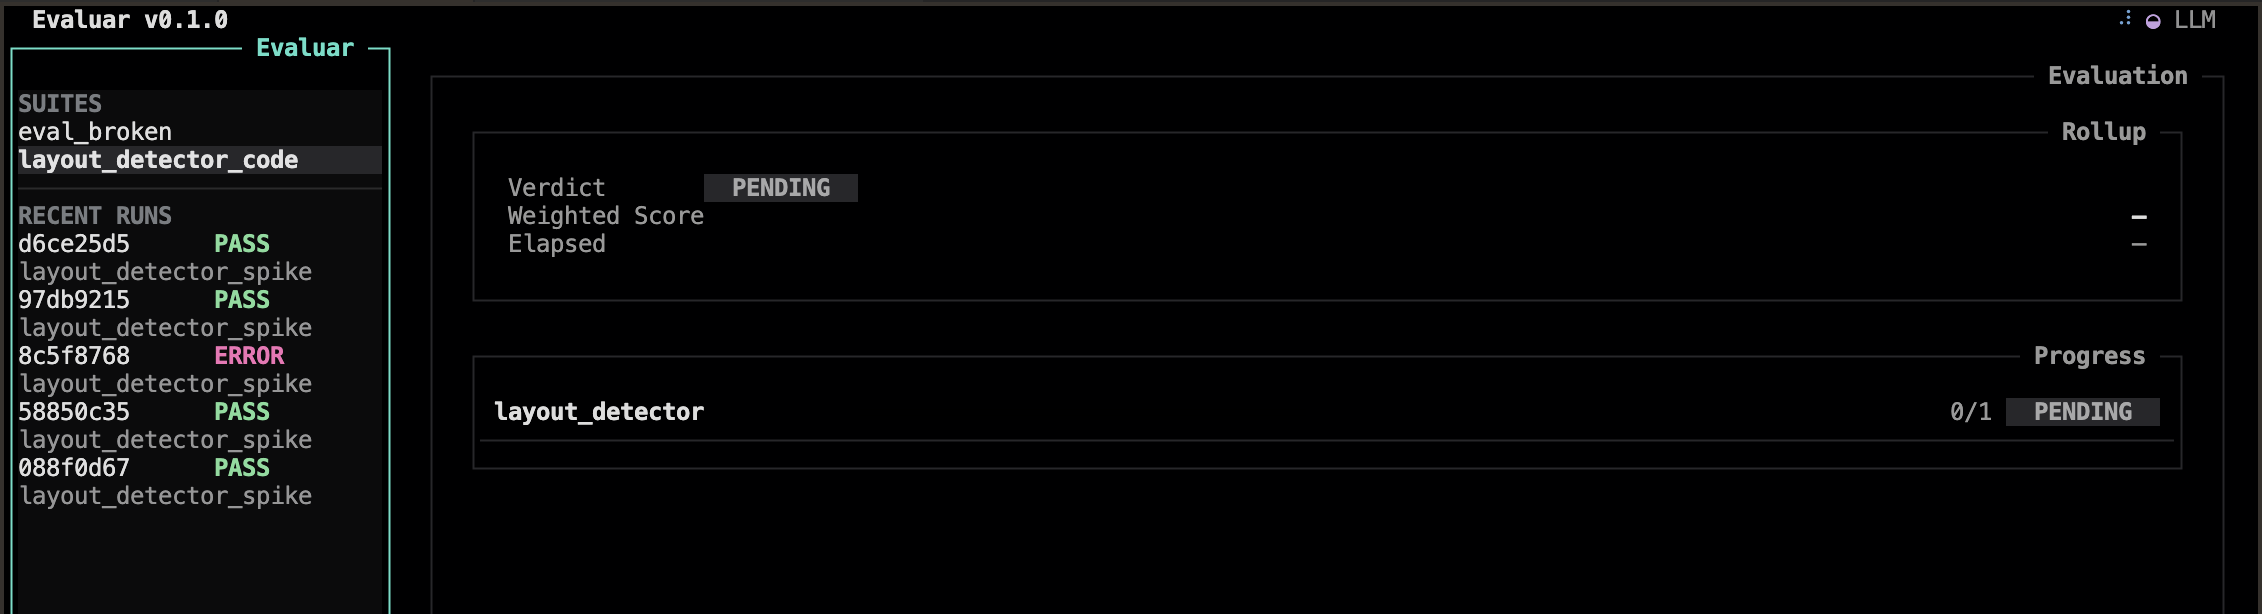
While a run is in flight, the dashboard view streams progress. This is the same data the run will write to disk on completion — viewing it live is not required for the run to save.
Compare
evaluar report compare <a> <b> opens the compare view (src/evaluar/tui/views/compare.py). It's a paired layout for diffing two runs at the rollup-scorecard level.
The bbox-editor hand-off
Pressing o or v from the results view or the failure inspector launches the bbox editor as a separate Python process (src/evaluar/tui/handoff.py:138). The TUI itself does not render images.
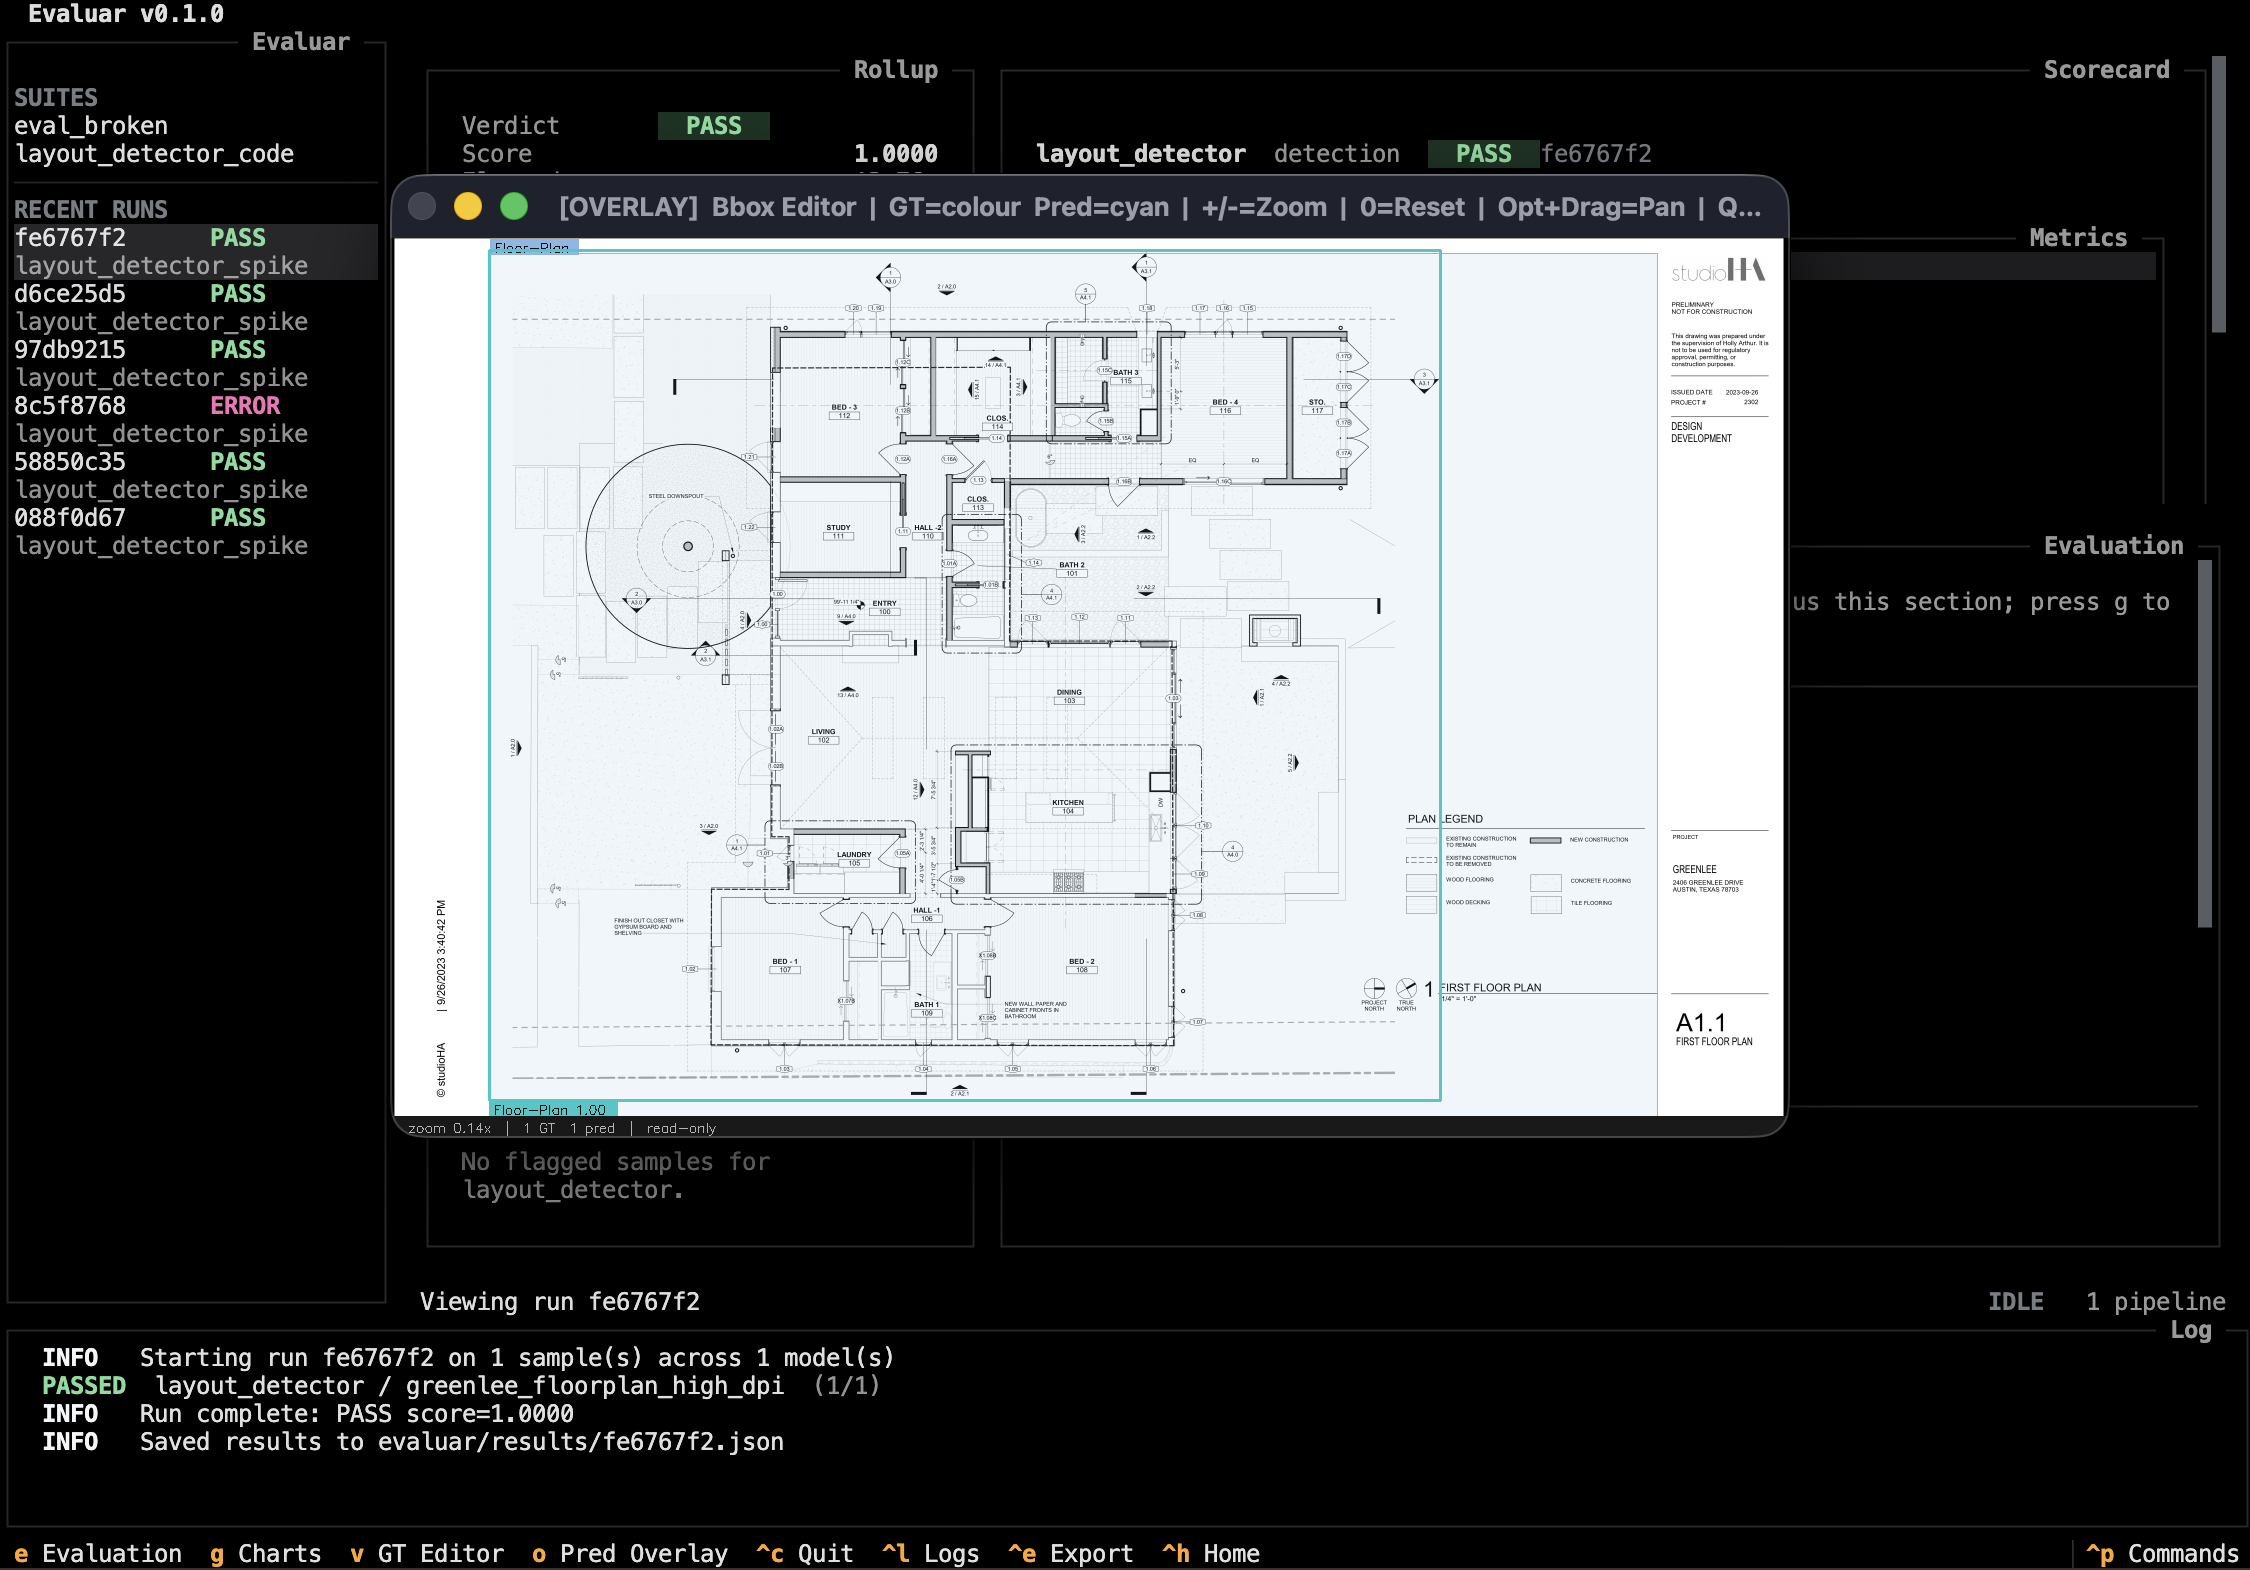
This separation exists for a practical reason: the TUI is a Textual app and OpenCV's UI is a native window. The bbox editor's keyboard surface is documented on the bbox editor page; it is not a TUI pane and shares no bindings with the rest of the app.
What about onboarding?
A first boot with no saved runs lands on the splash + home views (src/evaluar/tui/views/splash.py, home.py). The recommended first step from there is evaluar init <task> from a separate shell — see Install & init.