Evaluation infrastructure
for multimodal systems.
An API-first framework for measuring detection, OCR, and table systems — paired with a precision TUI for inspecting failures where they happen.
What it gives you
Built for the way evaluation actually happens.
Most evaluation tools optimize for dashboards. Evaluar optimizes for the moment a metric drops and you need to find out why — fast.
API-first by design
Every eval file is plain Python. The TUI is a view, not a gate — pipelines run the same way in CI as on your laptop.
Visual failure inspection
Move from aggregate metrics to flagged samples with structured diffs and prediction overlays.
Detection · OCR · Tables
First-class scoring for bounding boxes, text recognition, and structured table extraction — composable on the same run.
Calibrated metrics
IoU, AP, edit distance, schema checks, and table-structure metrics with threshold-driven verdicts.
Headless & CI-ready
Run suites from the shell, save JSON results, and gate builds with your own CI step.
Terminal-grade inspection
Keyboard-first navigation, charts, overlays, and a bbox editor for reviewing or fixing ground truth.
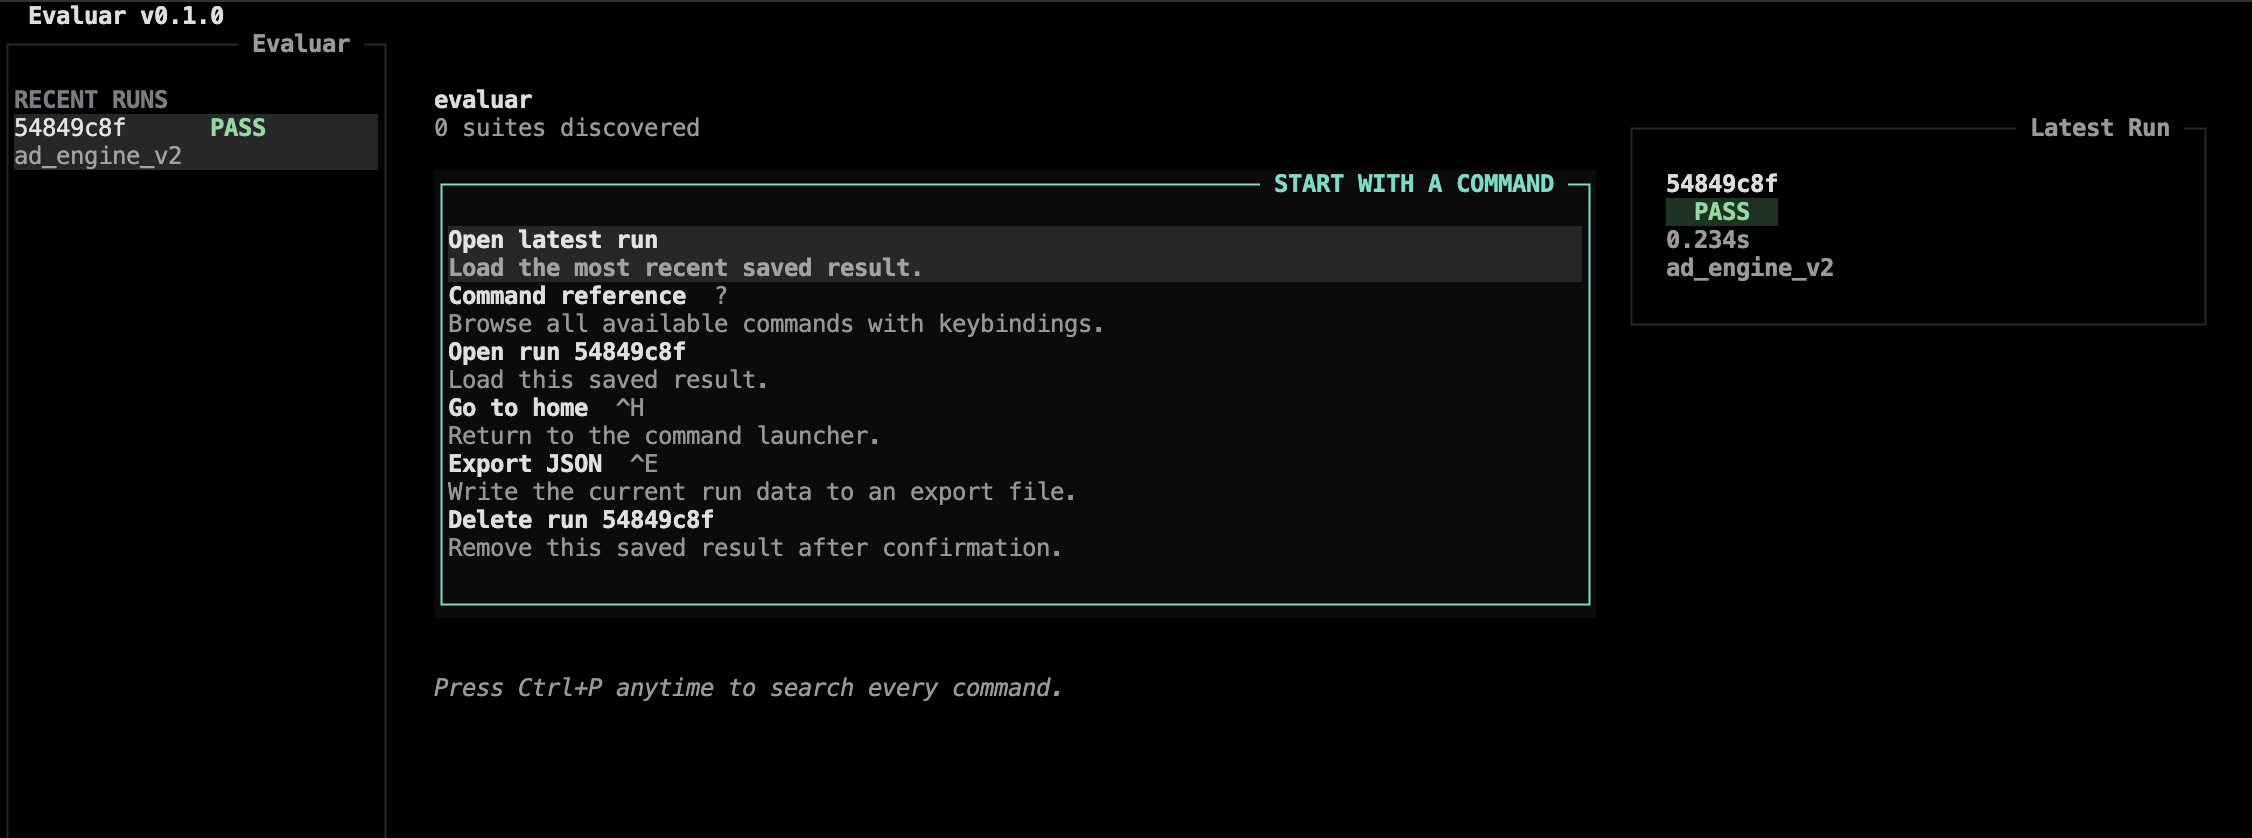
The TUI
A full-screen instrument for evaluation work.
Designed in the same tradition as htop, k9s, and lazygit — keyboard-first, information-dense, and calm under load.
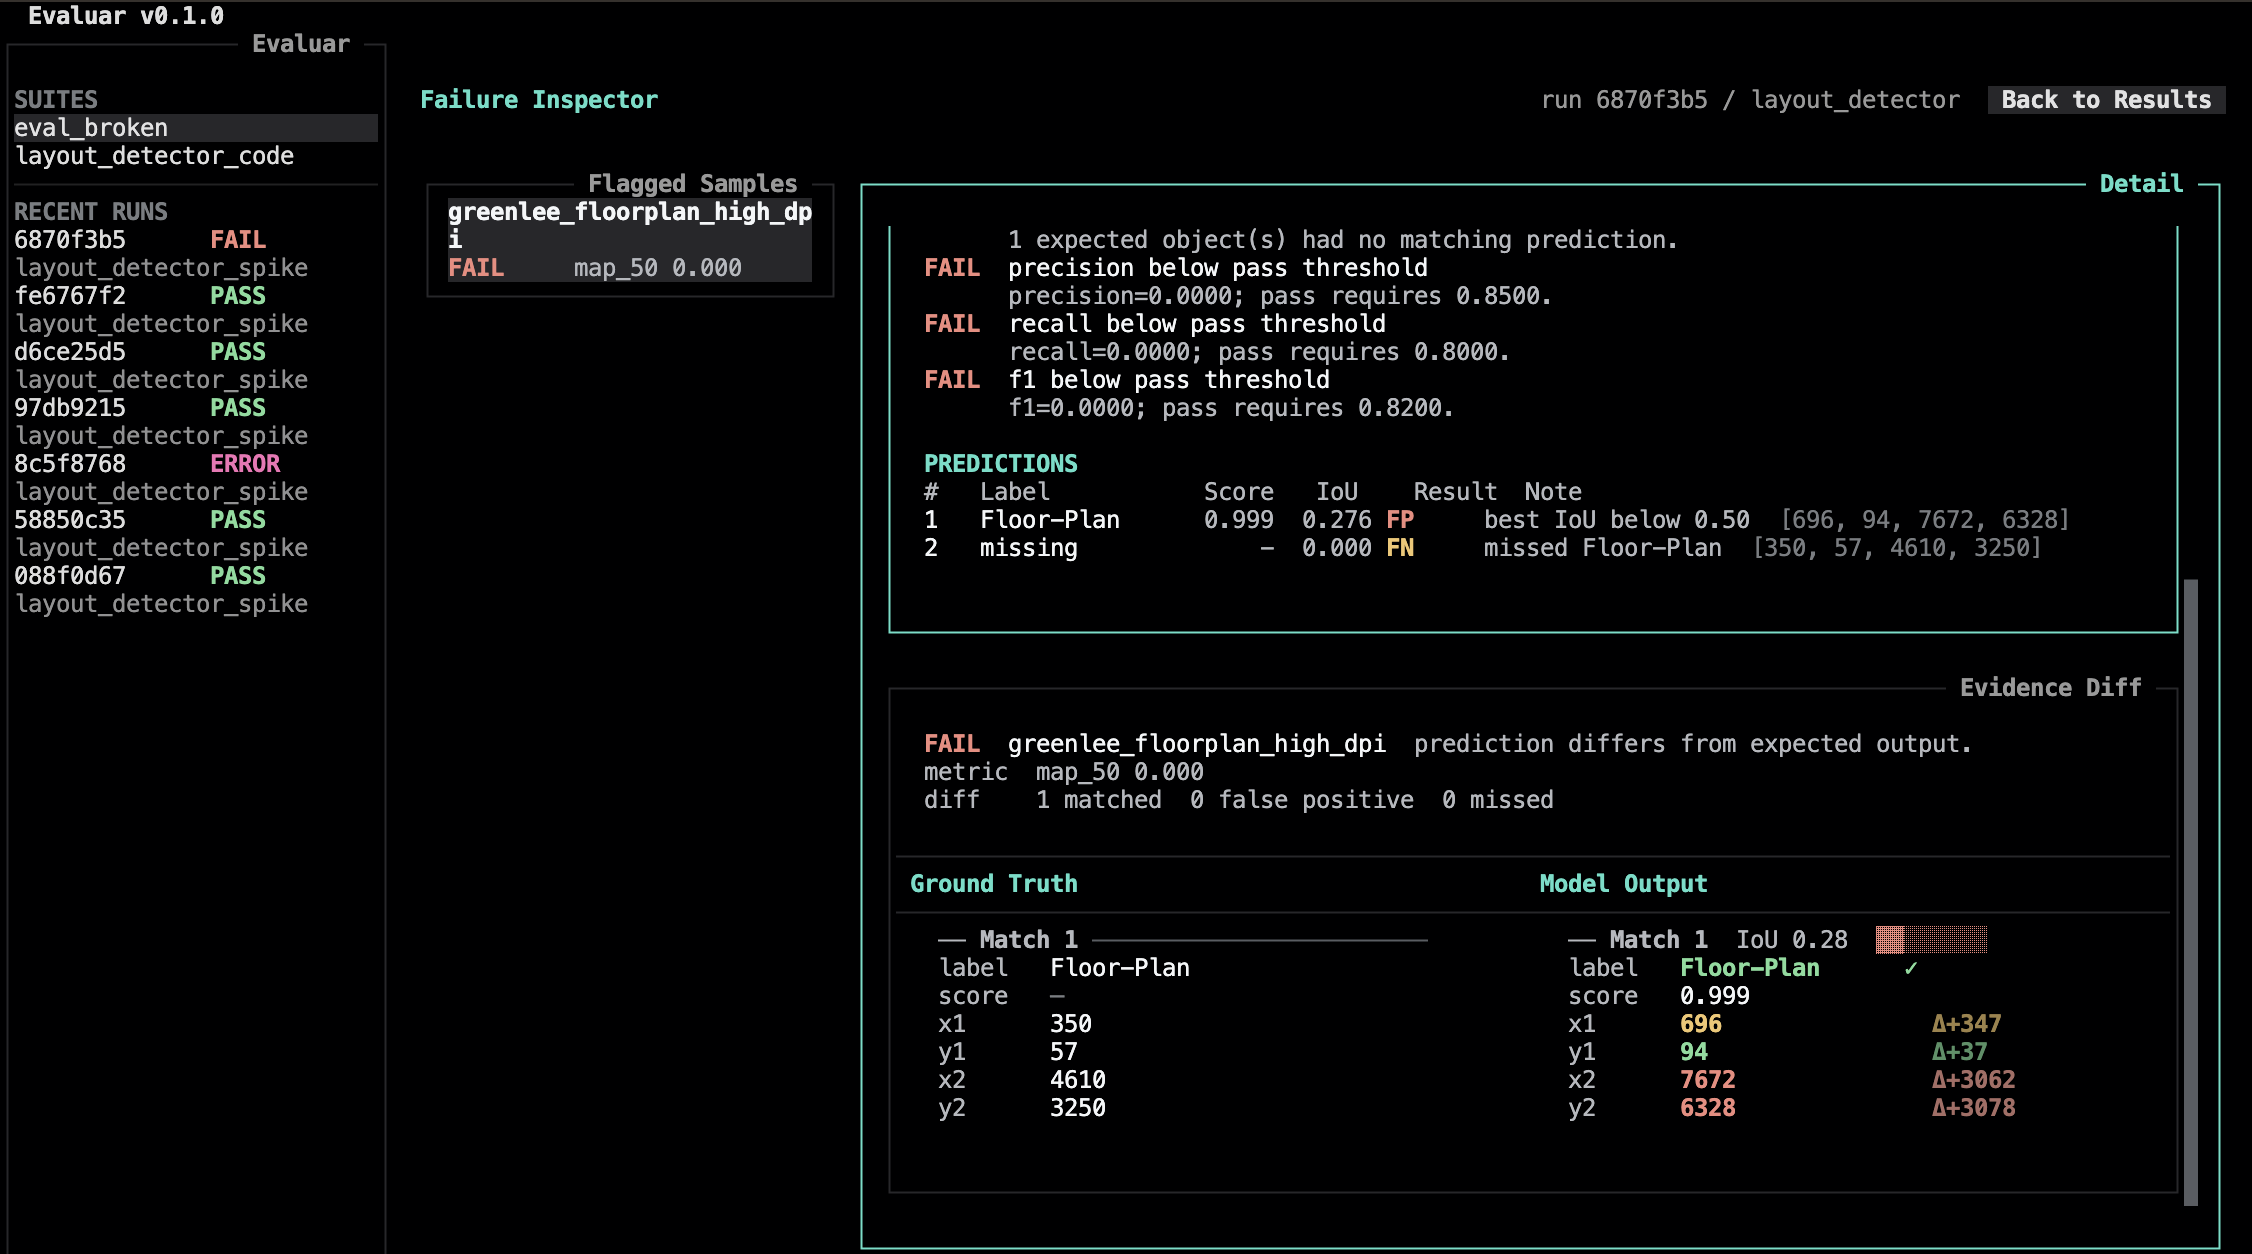
Inspect failures, not dashboards.
Open the failure inspector on a run and step through flagged samples. The detail pane keeps the configured verdict, metric context, and expected-vs-actual diff in view.
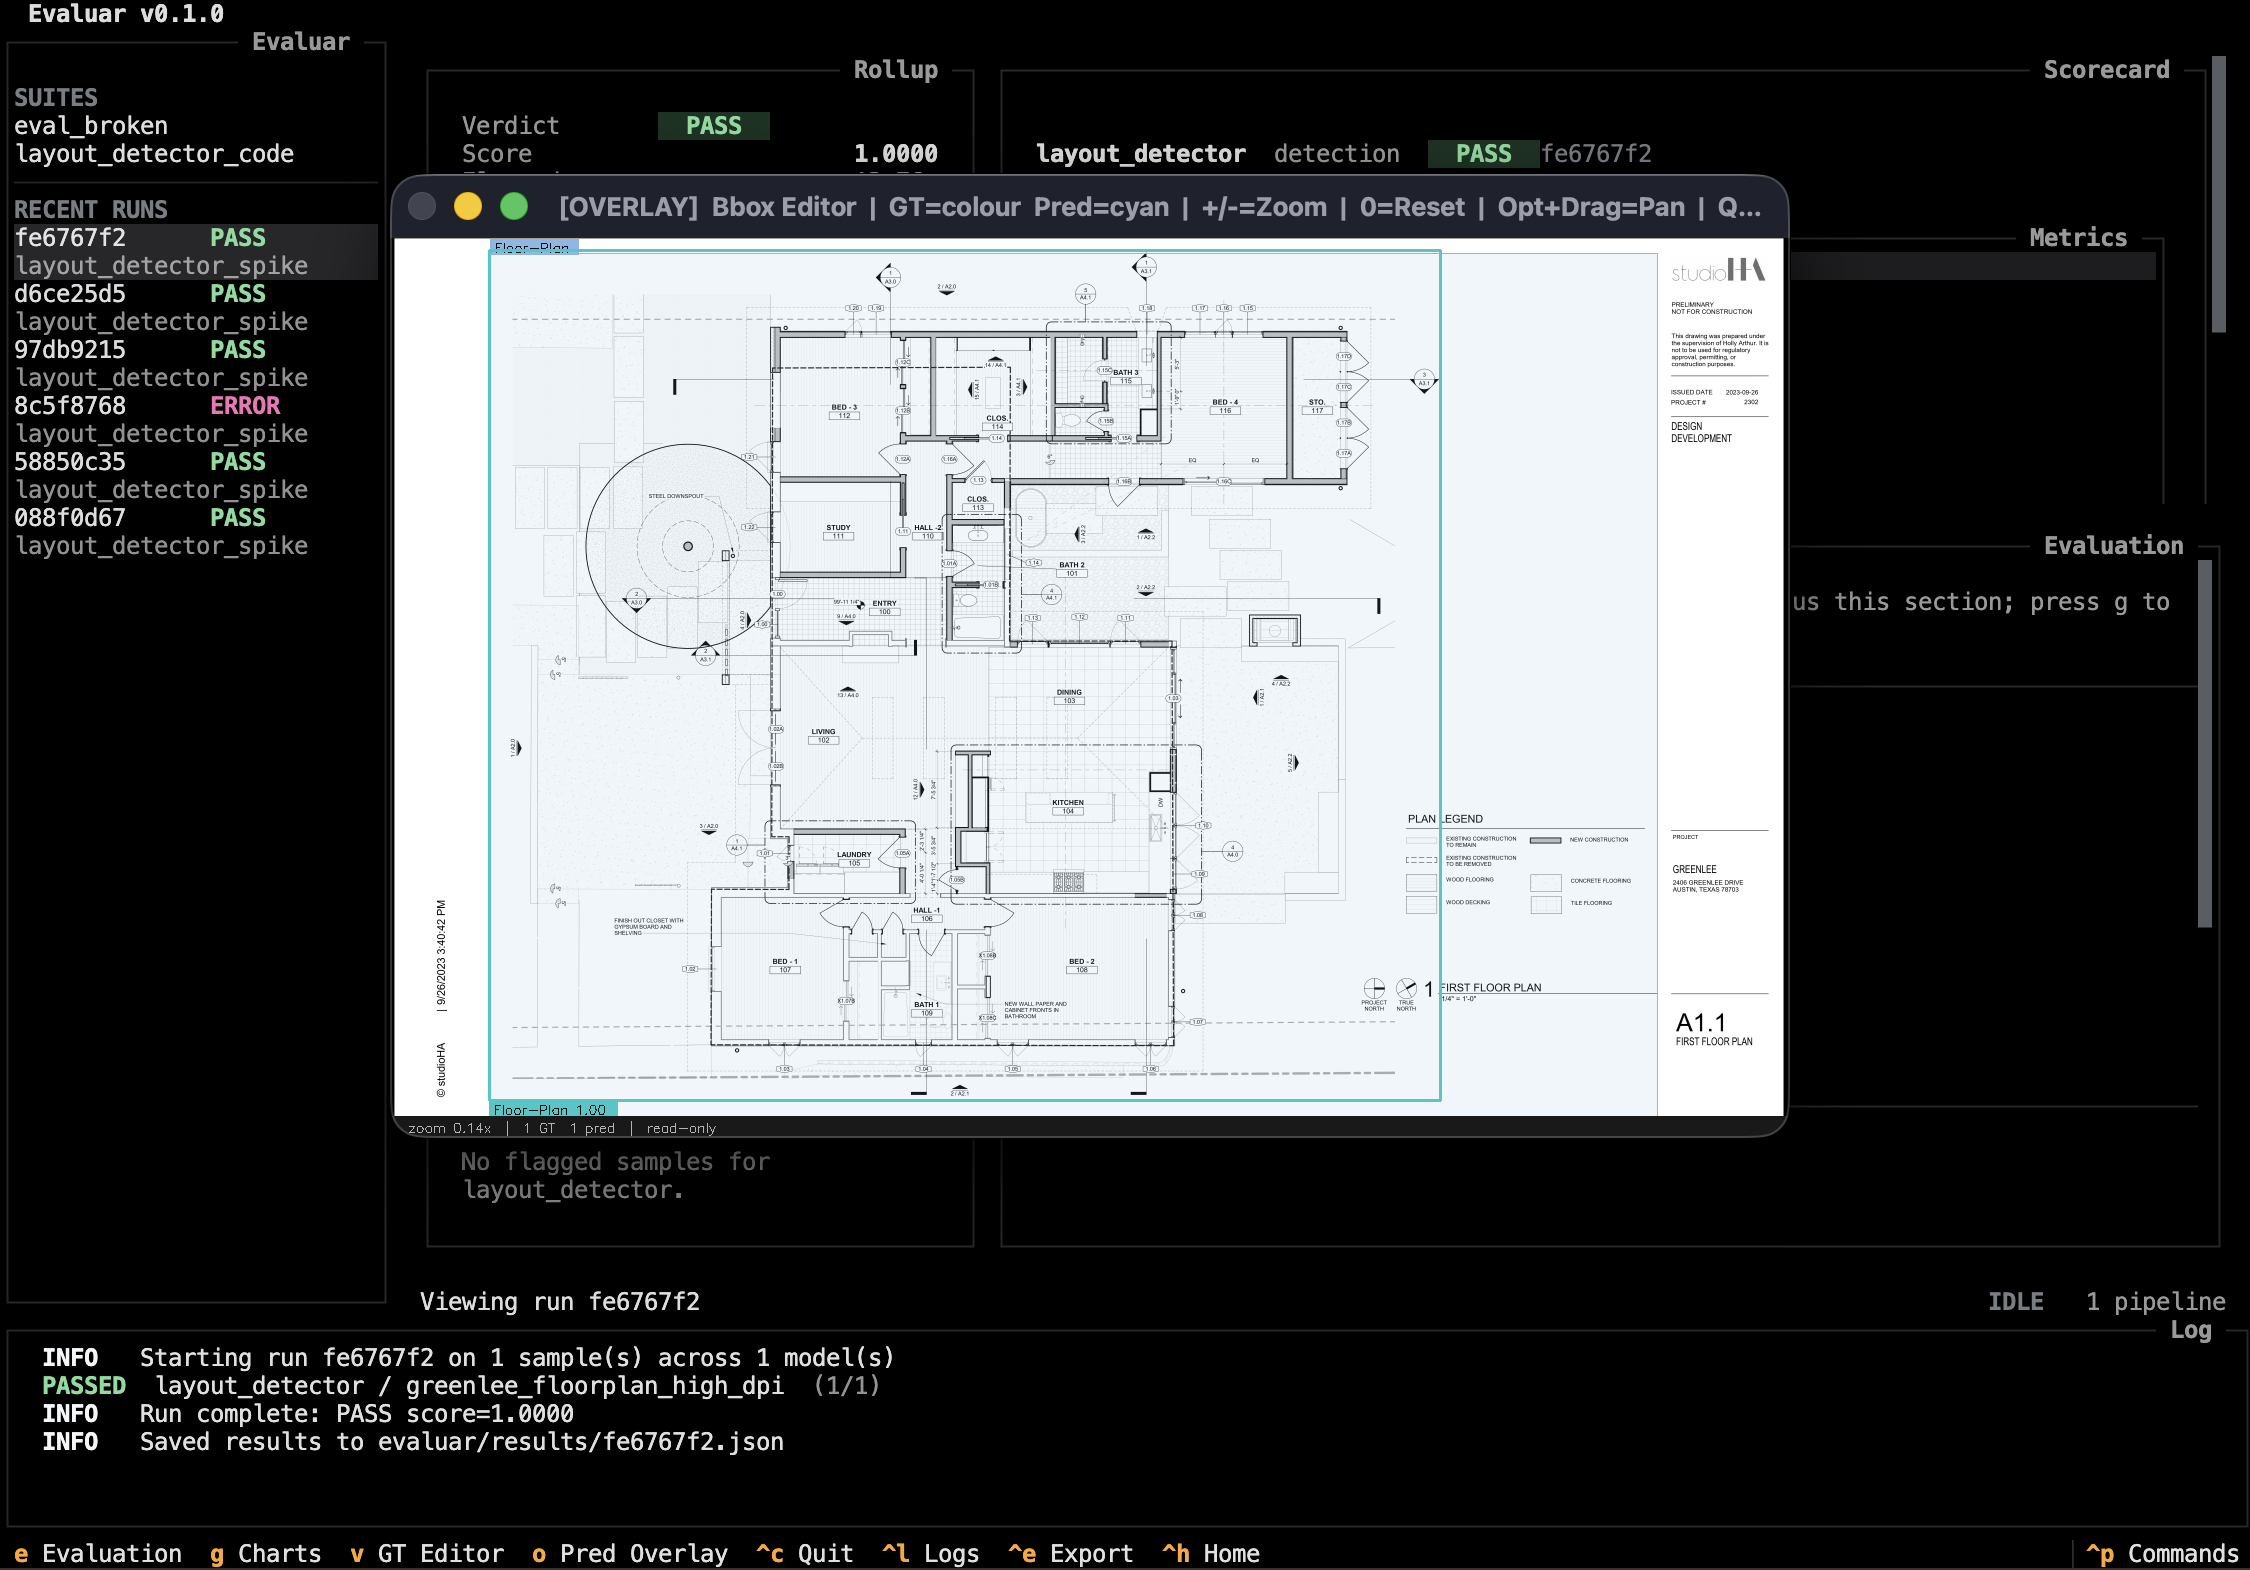
Bounding-box overlays, in the terminal.
A bbox editor renders predictions and GT side-by-side over the source image for overlays and small ground-truth corrections.
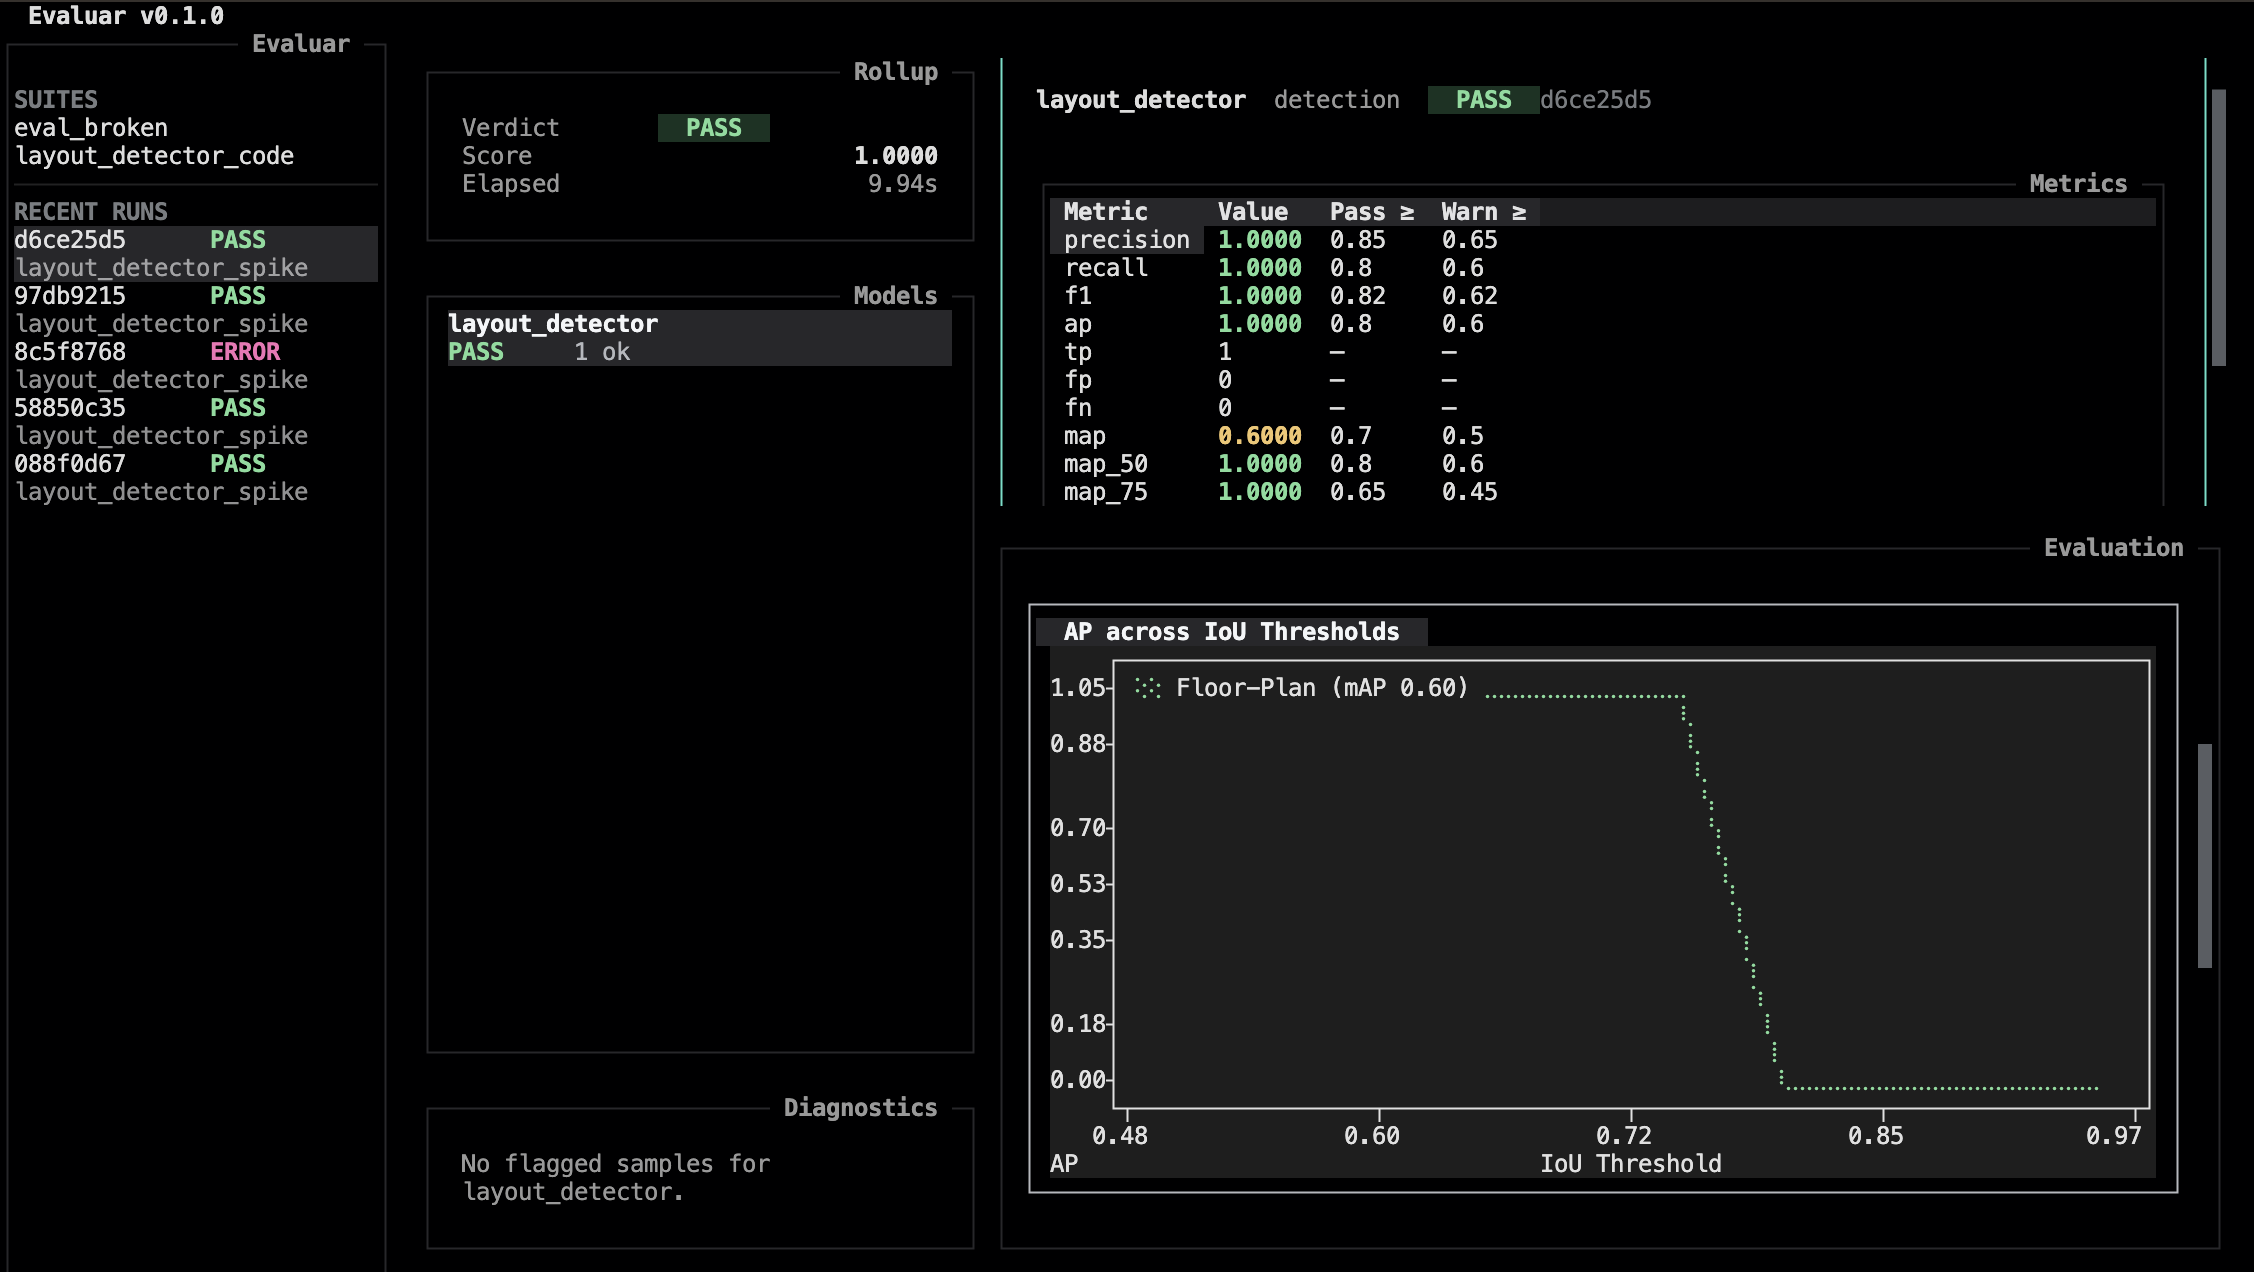
Charts where they help.
Toggle the charts pane from the results view to see metric curves, per-class bars, and confusion-matrix-style summaries for the selected model.
API-first
One pipeline.
Two surfaces.
Define an eval file once in Python. Run it from the shell for CI, or save the result and open the same scorecards in the TUI when you need to inspect failures interactively.
from evaluar.api import detection, suite

def build_suite(sample_ids=None, config=None):
    ids = sample_ids or ["sample_001"]
    pipeline = (
        detection("layout_detector")
        .callable(my_detector)
        .inputs(INPUTS)
        .ground_truth(GROUND_TRUTH)
        .default_mapping()
        .build()
    )

    s = suite(sample_ids=ids, suite_name="layout")
    s.add_pipeline("layout_detector", pipeline)
    return s

if __name__ == "__main__":
    result = build_suite().run(save=True)
    print(result.rollup_scorecard.verdict.value)
Stop guessing why the metric moved.
Evaluar gives you the path from a number went down to here is the failing sample in seconds.